
Authors: Sri Murniani Angelina Letsoin, David Herak, Fajar Rahmawan, Ratna Chrismiari Purwestri
Department of Mechanical Engineering, Faculty of Engineering, Czech University of Life Sciences Prague, Kamycka 129, 16500 Praha-Suchdol, Czech Republic
2
Faculty of Engineering, University of Musamus, Merauke Regency, Papua 99611, Indonesia
3
INTSIA Foundation of Papua Province, Furia 3 Number 116 Abepura, Jayapura City, Papua 99225, Indonesia
4
Faculty of Forestry and Wood Sciences, Czech University of Life Sciences Prague, Kamycka 129, 16500 Praha-Suchdol, Czech Republic
5
Institute of Nutritional Sciences, University of Hohenheim, Garbenstrasse 28, 70599 Stuttgart, Germany
*
Authors to whom correspondence should be addressed.
Abstract
Long-term land cover changes play a significant driver of ecosystem and function of natural biodiversity. Hence, their analysis can be used for evaluating and supporting government plans, especially conservation and management of natural habitats such as sago palm. In Papua Province of Indonesia, sago palm has been stated as one of the priority plants in the Medium-Term Development Plan (R.P.J.M.). However, limited studies have examined this palm in one of the Regencies of Papua Province, namely, Merauke Regency. In this study, we performed remotely sensed data imagery and supervised classification to produce land cover maps from 1990 to 2019. During the study period, twenty-one land cover classes were identified. The six classes of the natural forest consist of primary dryland forest, secondary dryland forest, primary mangrove forest, secondary mangrove forest, primary swamp forest, and secondary swamp forest; thus, fifteen classes of non-forested area. Concerning the sago palm habitat, our study evaluated two different categories (1) based on the land cover scheme from the Ministry of Environment and Forestry and (2) according to the peatland land cover ecosystem in Papua. Based on paired samples t-test, the result indicated statistically significant changes specifically at primary dryland (p-value = 0.015), grassland (p-value = 0.002) and swamp (p-value = 0.007). Twelve from 20 districts of Merauke Regency tend to lose the forecasted natural habitat of the sago palm. Therefore, this study suggests the further need to recognize and estimate the yield of sago palm area in these various ecosystems.
1. Introduction
The land cover indicates the physical land class covered by swamp forests, mining areas, and other land cover classes. In contrast, land use refers to the purpose land serves, for example, recreation and wildlife habitat. Land cover and land use are often used reciprocally, but both of them can be performed to support various purposes, for instance, identification and change detection [1,2]. Land cover changes information is useful to achieve a better perspective of landscape dynamics and is also proper for evaluating the sustainability of natural resources [3,4]. Thus, ground cover monitoring and mapping are required to investigate spatial planning and environmental examination [5,6]. Additionally, land cover and land use analysis will help in the reliable prediction of future circumstances. For example, future changes in forest cover can be predicted using the substance gained from historical datasets and remote sensing observations [7].
Numerous studies have been conducted on the measurement of land cover change at a national as well as a global scale because of its tremendous impact on various aspects such as urban development, water supplies, or environmental studies [8,9]. Long-term monitoring of land cover changes is significantly needed to estimate carbon stock, ecosystem service, and biodiversity losses [10,11,12]. Generally, the main focus on developing countries such as Indonesia is related to the conversion of forest areas for supporting agriculture expansion, urban or infrastructure planning [13,14,15]. However, the loss of forest cover changes can rigidly decrease the natural sustainability of the site, including the loss of biodiversity, which leads to a reduction in ecosystem functioning and an increase in the climate change factor. To handle this, some strategic ways have been set up, for instance, the Indonesian Government in Presidential Instruction Number 3 of 2020 has mentioned about the mitigation of forest and land fires prevention, monitoring, and forest evaluation. Also, Presidential Decree Number 1 of 2016 established The Peat Restoration Agency or Badan Restorasi Gambut (B.R.G.) to coordinate and facilitate efforts to restore peat lands in several provinces, including in Papua [16,17].
In Papua, forest areas play an essential role as a natural habitat of sago palm that grows in the moist upland rainforest, freshwater, peat lands, swamps, or salty areas of tropical lowlands up to 700 m above sea level. The favorable preconditions date temperatures of above 25 °C and relative air humidity of around 70%; at the time of vegetative just before flowering, the plant transforms its saved nutrition towards starch, which fills the trunk. Thus, at the mature phase, it occupies a huge trunk and may reach a height of 6–10 m. Sago palm reaches commercial maturity at 9–12 years of age, when fruits start to develop and starch growth in the trunk reaches its highest level [18]. In comparison to other starches, sago produces an amount of approximately 400kg dry starch for each tree, while cassava or potato produces just around 40 kg [19]. Sago palm is also a part of indigenous costumes and, as a staple food, it will be cooked traditionally using burnt stones while the sago waste is used as livestock feed. Today, sago palm is said to be one of the priority plants in the Medium-Term Development Plan, or Rencana Pembangunan Jangka Menengah (R.P.J.M.), of Papua Province, because it provides many benefits in various sectors such as food security, the agro-industry, and environmental issues [20,21].
At the moment, current satellite imagery has been explored extensively for mapping and monitoring land cover changes using Landsat [22], Sentinel [23], Moderate Resolution Imaging Spectroradiometer (MODIS) [24], Synthetic Aperture Radar (SAR) [25], Satellite Pour I ‘Observation de la Terre (SPOT) [26], Pleiades [27], and other openness of data satellites. Furthermore, a broad range of suitable spectral bands with a very high resolution and accessibility with various computer-aided software has improved the use of remotely sensed data. For instance, the System for Automated Geoscientific Analyses (SAGA) [28], Quantum Geographic Information System (QGIS) [29], Sentinel Application Platform (SNAP) [30], eCognition [31], Earth Resources Data Analysis System (ERDAS) [32], and other platforms such as Google Earth [33] have improved the use of remotely sensed data. The long-term series of Landsat has been demonstrated successively to monitor land cover changes because of land degradation [34], to investigate land cover changes as a result of some variables such as urban expansion [35], flooding [36], deforestation [37], coastal abrasion [38], and vegetation spreads [39]. It continues to measure forest carbon stock [40], climate [41], biodiversity [42], and other land cover changes.
Although some studies have focused on monitoring land cover changes of Indonesia in general, we found studies applying remote sensing to evaluate changes in swamp forest land cover, and its impact on the natural habitat in this location are still unreported [43]. Therefore, this paper aims (1) to provide the current land cover maps for the Merauke Regency in Papua Province of Indonesia, (2) to evaluate land cover changes, and (3) to estimate the potential area forthe natural habitat ofthe sago palm. To deal with these objectives, we combined existing land cover maps that we obtained from the Ministry of Environment and Forestry (MoEF) and Landsat imagery to create new land cover maps. Thus, we calculated the rate of land cover change throughout the study. Regarding the sago palm habitat, this study examined the natural ecosystem of sago palm habitat based on two categories, i.e., (1) based on MoEF land cover scheme [44], and (2) peatland land cover in Papua [45]. We also applied statistical analysis to investigate the significant change of sago palm habitat based on their land cover. Our findings provide current land cover maps and the evaluation of land cover map changes over time, which can be used to support decision-making of the local Government for managing and conserving natural resources.
2. Materials and Methods
2.1. Study Area
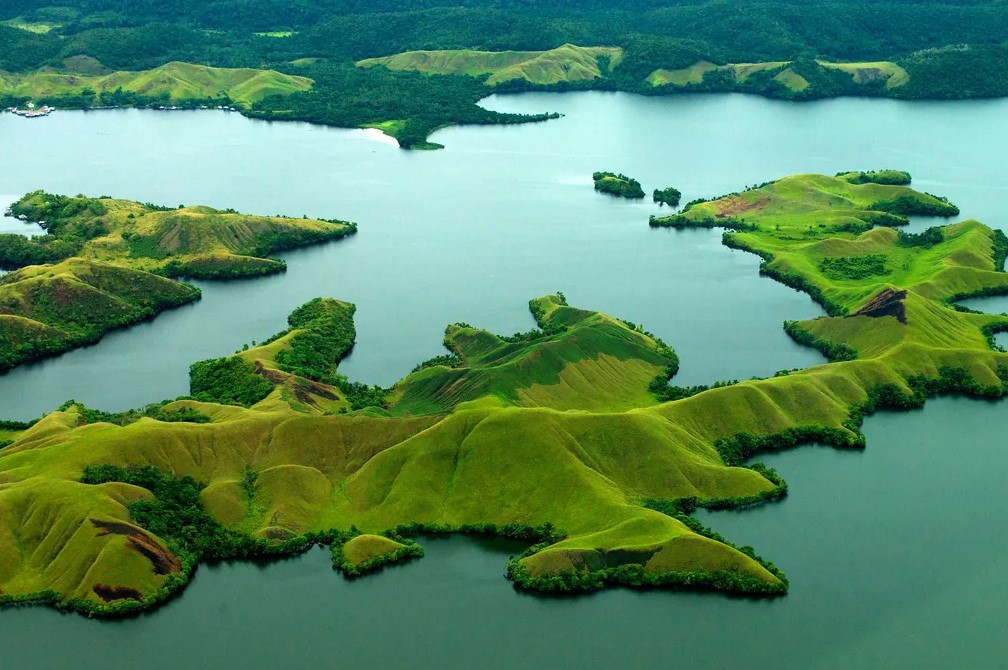
The study was carried out in Merauke Regency (137°38′52.9692″ E–141°0′13.3233″ E and 6°27′50.1456″ S–9°10′1.2253″ S; Figure 1), which is located on the southern part of Papua Province. Papua Province is one of the thirty-four provinces of Indonesia, with a total area of about 31,509.162 ha and is noticed as a province with the most significant area. Papua and West Papua contribute to approximately 10% of the world mangrove area within various ecosystems [46]. In this study, the selected sago palm tree is scientifically known as Metroxylon sagu Rottb. The palm tree is one of the ecological tree species that grows in Indonesia, particularly in Papua and West Papua [21]. The palm has tremendous advantages to support the food sector, bioethanol [47,48], as a raw material for the agro-industry, and other aspects of sago [20]. This palm rises well in freshwater such as in Jayapura and swamps or salty areas of tropical lowlands, for example, in Merauke Regency.
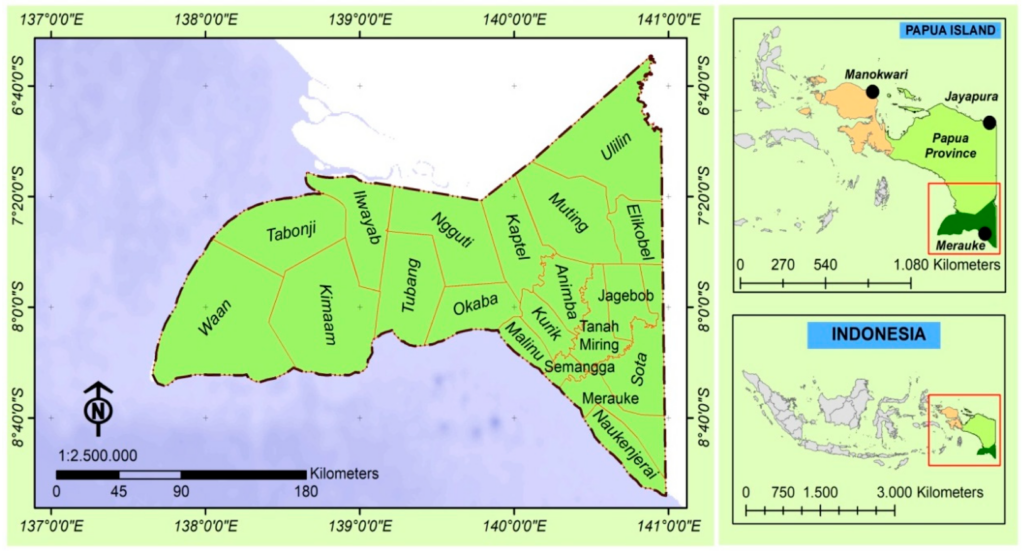
Figure 1. Geographical position of study area. The study area has boundaries with Mappi and BovenDigoel Regency to the north, the Arafuru Ocean to the south and west, Papua New Guinea to the east.
Merauke Regency encompasses twenty districts, namely, Ulilin, Muting, Kaptel, Ngguti, Ilwayab, Tabonji, Waan, Kimaam, Tubang, Okaba, Malind, Kurik, Animha, Elikobel, Jagebob, Tanah miring, Semangga, Sota, Naukenjerai, and Merauke). The capital of Regency is located in Merauke. This Regency occupies an area of around 4,851,715 ha and is well known as the largest Regency in Papua Province. Merauke Regency is also a leader of the top three paddies providers, with about 91.47% of paddy production over Papua Province [49].The site Regency is bordered directly with Papua New Guinea and Australia, with an average temperature of around 27 °C, while the humidity is about 81%. The type of forest in this regency consists of primary forest and secondary forest, including mangrove, swamp, and dryland [49,50].
2.2. Data Acquisition and Preprocessing
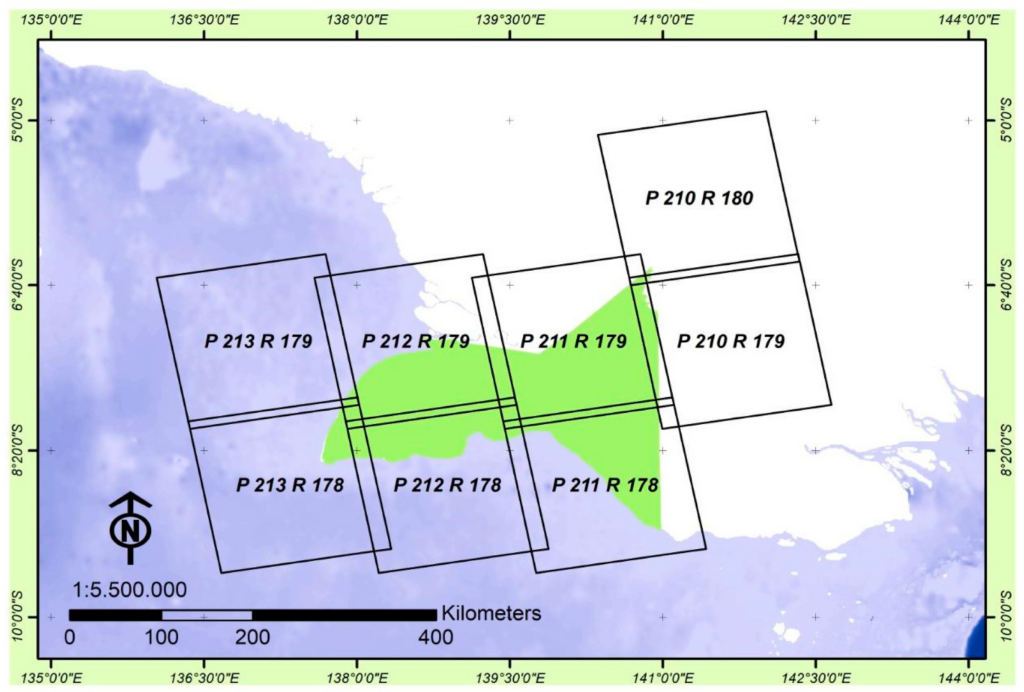
In this study, two types of data from remotely sensed and secondary data were analyzed. Several secondary data such as the type of forest, area of forest by function, were contributed by Government agencies, i.e., Plantation and Forestry, and statistics agencies through their catalogues: Papua Province in figure 2020 (Number of catalogue: 1102002.94) [49], and Merauke in figure 2020 (Number of catalogue: 1102002.9401) [50]. Existing land cover maps for 1990, 1996, 2003, 2006, 2011, and 2014 were published on www.webgis.menlhk.go.id. The provincial boundary spatial data were acquired from the Regional Development Planning Agency or Badan Perencanaan Pembangunan Daerah (BAPPEDA) of Papua Province that we used as supporting data. Land cover classes of Indonesia and the description are referred to the Ministry of Environment and Forestry (MoEF), which includes the Standardization Agency of Indonesia or Badan Standardisasi Nasional (B.S.N.), specifically, the Indonesian National Standard or Standard Nasional Indonesia (S.N.I. 8033:2014). The land cover is classified into twenty-three classes that consist of six classes of forests, one plantation of the forest, 16 classes of non-forests (Table 1). To achieve remotely sensed data (Table 2), we used Landsat multispectral images that, since 1972, have provided sensor Multispectral Scanner Systems (MSS)/Return Beam Vidicon (RBV) (1972/1978), MSS/Thematic Mapper (TM) (1982/1984), Enhanced Thematic Mapper (ETM+) (1993/1999) and Operational Land Imager/Thermal Infrared Scanner (OLI/TIRS) (2013). In this study, we applied Landsat 7 ETM + and Landsat 8 OLI/TIRS (L1T) multispectral images covering the study area. The L-1Terrain (L1T) product will automatically correct their geometrics and radiometric based on inputs from the sensors as well as the Ground Control Point (G.C.P.) and Digital Elevation Models (D.E.M.). We obtained data freely for the years 2000, 2009, 2015, 2016, 2017, 2018, and 2019 (E.T.M. + and OLI/TIRS), with 30 m of the resolution, 705 km of altitude, and less than 50% cloud cover. To reduce this cloud cover, we combined multitemporal Landsat images from two seasons of Papua, which were appropriately selected from Figure 2.
All remote sensing data were downloaded from the archives of the United States Geological Survey (USGS), available on https://earthexplorer.usgs.gov/. We also recorded field data location using a hand-held global positioning system (G.P.S.).
After extracting the images, we carried out preprocessing steps consisting of radiometric calibration to remove the effect of atmospheric, illumination angles, and seasonal variation across the image [51]. Then, we projected the image according to our study area (European Petroleum Survey Group/EPSG: 23894), which is Universal Transverse Mercator (U.T.M.) World Geodetic System (W.G.S.) 84, in zone 54S local projection type. Preliminary image based on the area of interest was conducted using false color composites of red, green, and blue. To add these, we also did image enhancement and mosaicking to merge the image frame; all the preprocessing tasks here were carried out using the System for Automated Geoscientific Analyses (SAGA) Geographic Information System (GIS) that was included in the Quantum GIS (QGIS) software.
2.3. Data Processing
For image classification, firstly, the actual land cover maps from MoEF (1990, 1996, 2003, 2006, 2011, 2014, and 2017) were clipped and overlaid on Landsat imagery in the same year. During this process, we looked at the entire map and made corrections wherever it was needed. Afterwards, supervised classification was applied [52]; training samples were selected by delineating polygons at characteristics sites. We chose 15 of each class as the training data; at this step of the procedure, we also compared each class that was collected in the fields using G.P.S. The accuracy assessments of the image classification were done as an integral part of the image classification process using QGIS. Next, we developed land cover maps for other years (2000, 2009, 2015, 2016, 2018, 2019) by analyzing the supervised classification result and the existing land cover maps. Since the visual interpretation should be more standardized, we therefore complied with the Ministry of Environment and Forestry scheme [44], which included the Indonesian National Standard (S.N.I.), particularly SNI 8033:2014, that allows us to recognize the image through structure, texture, shape, pattern and color; at the same time, grants land cover classification in Indonesia (Table 1). According to that scheme, there were twenty-three land cover classes in total, consisting of 6 classes of natural forests, 1 class of plantation forest, 16 classes of non-forest. Following the natural habitat of sago palm, there were two sites, i.e., primary swamp forest and secondary swamp forest. At the final step, we validated the land cover maps by using a geographic browser, which is Google Earth Pro [53], that provides a higher resolution of satellite imagery. We ensured that checkpoints were spread throughout the study area and expressed all land cover classes; nonetheless, these numbers were selected in a different amount due to the possibility of high resolution images.
2.4. Data Analysis
The land area for general characteristics of the study site were presented in mean and standard deviation (minimum, maximum). Land area changes over time were analyzed using the paired t-test [54,55] for the years 1990 and 2019. To designate the statistical significance in all analyses, a p-value of less than 0.05 was used. Statistical analysis was performed using IBM SPSS statistics version 25 (IBM Corp., Armonk, NY, USA). In this study, a t-test was performed to examine the means of land cover for the general characteristics of the site and whether or not the natural habitat of sago palm has significantly changed throughout the study.
Moreover, we also calculated gain and losses [56], the rate of land cover change, in the following way (Equation (1)) [57,58].
𝑡ℎ𝑒 𝑐ℎ𝑎𝑛𝑔𝑒 𝑟𝑎𝑡𝑒 𝑜𝑓 𝑙𝑎𝑛𝑑 (𝐶)=𝐴𝑟𝑒𝑎(𝑓)−𝐴𝑟𝑒𝑎(𝑖)𝐴𝑟𝑒𝑎(𝑖)�ℎ� �ℎ���� ���� �� ���� (�)=����(�)−����(�)����(�)
Area(f) and Area(i) are the areas of a certain land type at the final area or at the end, while Area(i) represents an initial or at the beginning of the research period, respectively. The negative rate number of the land cover shows a decreasing trend during the period of study, while in contrast, the positive number indicates an increasing area of each class or category.
3. Results
3.1. Land Cover Changes in Merauke Regency
Recent land cover maps from 1990 to 2019 are presented in Figure 3; we made 13 years of land cover maps in this Regency, consisting of land cover maps in 1990, 1996, 2000, 2003, 2006, 2009, 2011, and from 2014 to 2019. Twenty-one land cover categories were identified: (1) 6 classes of the natural forest included primary dryland forest, secondary dryland forest, primary mangrove forest, primary swamp forest, secondary mangroves forest, secondary swamp forest; (2) 15 classes of non-forest consisting of swamp shrub, swamp, bush/shrub, estate crop plantation, settlement area, barren land, clouds, grassland, water body, dryland agriculture, shrub-mixed dryland, paddy field, fishpond, airport, transmigration area (Figure 3). By using supervised classification [1] of remotely sensed imagery, it is possible to get the resultant area estimates that occurred in this Regency, as shown by Table 3, Table 4 and Table 5.
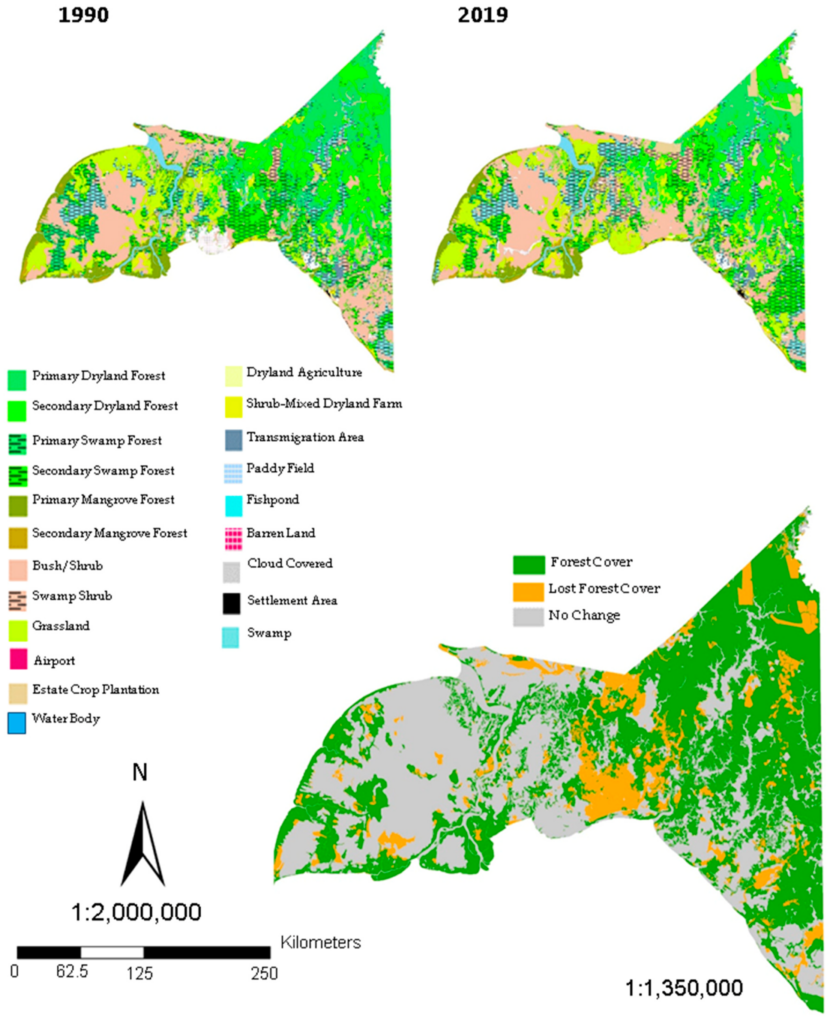
In 1990, Merauke Regency was covered by the natural forest of around 2,440,396 ha, or approximately 50.3% (Figure 4), compared to the non-forest area of about 2,411,319 ha, or 49.70% of total area (Table 3). Although this Regency was dominated by natural forest, the area cropped highest by swamp shrub and was followed by three classes of natural forest area, namely, primary dryland, secondary dryland and secondary swamp forest, around 19.17%, 14.32%, 13.15%, and 10.95%, with areas of 930,069 ha, 694,737 ha, 638,049 ha, and 531,109 ha, respectively. Also in 1990, the land cover map did not include estate crop plantation and fishpond. Conversely in 2003, this site was mostly covered by non-forest area for about 2,780,824 ha (Table 3), or approximately 57.32% of the total area, while the natural forest had an area of 2,070,891 ha, or about 42.68%.
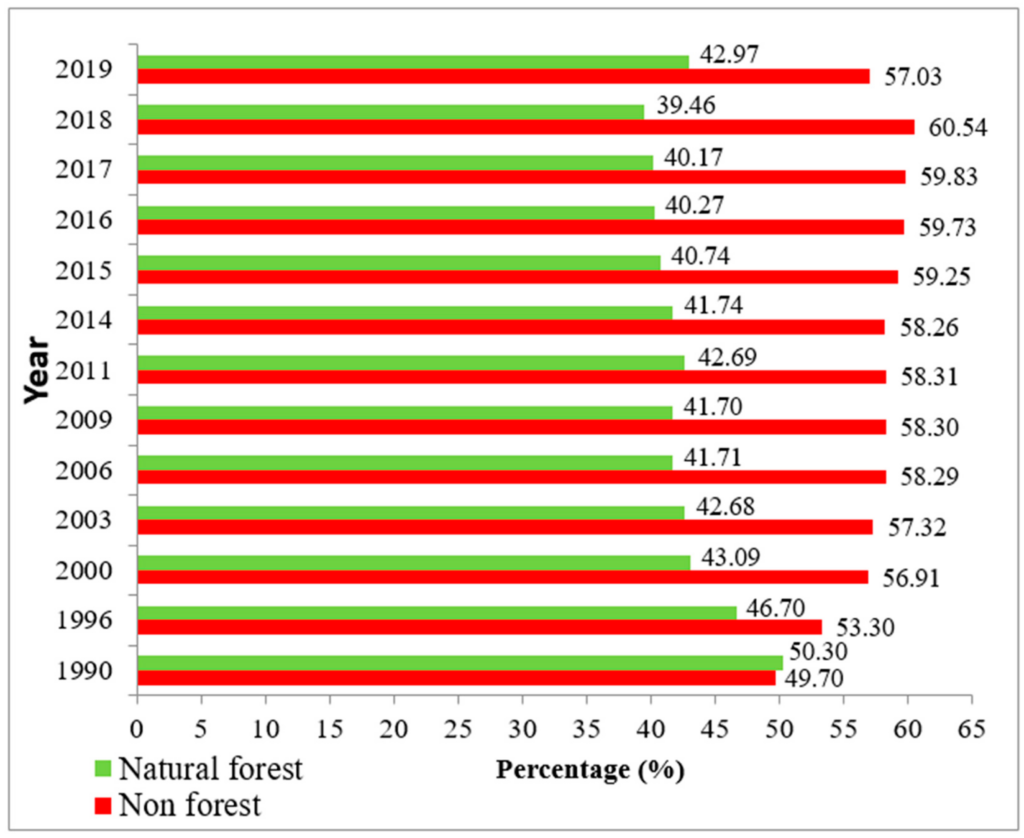
In 2006, the Regency was also coated by a non-forested area of 2,828,047 ha, or 58.29%, while the natural forest was decreased to 41.71% (Table 4). The most typical land cover of this Regency was swamp shrub with the area of 949,786 ha, followed by two other land cover types, i.e., grassland about 655,175 ha, and secondary dryland forest with the area around 627,494 ha. The pattern of land cover changes continued in 2014; this Regency was also mostly covered by the non-forest area, which is swamp shrub, grassland, and another class of natural forest, namely secondary dryland forest. The total area change in 2014 was about 906,111 ha, 708,703 ha, and 678,803 ha, respectively.
In 2015 (Table 5), it is shown that the natural forests were 1,977,080 ha, or approximately 40.75%, of the total area. Thus, the non-forest occupied 2,874,635 ha or near to 59.25%. This percentage explained why, in 2015, the non-forest category revealed an increasing trend which was about 18.5% higher than the natural forest. The area was still wrapped highest by swamp shrub for about 860,813 ha and was followed by the secondary dryland forest (664,888 ha). The grassland seems to decrease compared to the previous year. In 2018, the non-forest area reached the highest percentage of change: a loss of about 60.54% more than the natural forest, which tended to lose space for around 39.46% of the total Regency area. The dominant land cover in 2018 was swamp shrub, secondary dryland forest, and then grassland. Even though in 2019 the Regency was still covered by non-forested area (for about 2,767,158 ha or 57.03% of the entire site), the area of natural forest slightly increased about 3.51% compared to 2018 (Figure 4).
3.2. Land Cover Losses and Gains from 1990 to 2019
Land cover category losses and gains were also examined in this study. The total changed areas for each class are shown in Table 6. The result indicates that five classes of natural forests were generally decreasing; only one class of it, that has a small number, was increasing. Primary swamp forest was reduced by around 40.95%, followed by primary dryland forest, that also decreased by about 27.98% during this period. Likewise, primary mangrove, secondary mangrove, and thus, the secondary dryland forest were also reduced by around 6.39%, 5.07%, and 1.06% respectively, while only secondary swamp forest had gained not up to 0.03% in terms of the total area and the percentage of change. In contrast, in the non-forest category, the paddy field was the significantly increased area with an overall percentage of change of about 316.26%. Thus, an expansion of about 124.38% in the settlement area was observed. On the other hand, we could not examine the percentage of the changed estate crop plantation and fishpond due to the lack of initial value in 1990. Furthermore, the transmigration area and water body lost their aerial extent around 30.20% and 0.61%. Other non-forest categories gained less than 80%, i.e., bush/shrub, shrub-mixed dryland, dryland agriculture, grassland swamp, airport, barren land, and swamp shrub subsequently around 79.95%, 57.84%, 50.73%, 17.72%, 10.94%, 10.27%, 8.85%, and 1.39%, respectively. Although the transmigration and water body lost their areas, the overall non-forest gained an increasing trend in the 1990–2019 change period. We evaluated the natural habitat of sago palm based on the land cover changes of the Regency. We used two different categories, i.e., (1) based on the Ministry of Environment and Forestry land cover schemes (Table 1) and (2) the peatland land cover ecosystem of Papua [45]. In [44] (Table 1), as mentioned previously, it predicts two typical habitats of the sago palm, namely, primary swamp forest and secondary swamp forest. Other natural ecosystems were forecasted, i.e., dryland forest, bush/shrub, swamp, swamp shrub, and savanna/grassland [45]; the local community usually utilizes this peat ecosystem to find fish, or to plant and harvest sago palm [45]. Here, we assessed statistically twenty districts of Merauke Regency, by including eight classes of the potential habitat of the sago palm(primary dryland forest, secondary dryland forest, primary swamp forest, secondary swamp forest, bush/shrub, grassland, swamp shrub, swamp), as shown by Table 7 and Table 8 using the paired samples t-test for the years 1990 and 2019. We used this result to examine the significant changes of the various natural sago palm ecosystems in Merauke Regency as well as to support our third aim of this study.
Table 7 presents that, in 1990, Semangga, Malind, Kurik, and Naukenjerai did not have a possible area of sago of more than 11 ha, while Waan, Ulilin, Kimaam, and Ngguti had a larger potential area of sago habitat compared to other districts, with the mean value of the land area of 60,482.52 ha, 56,469.20 ha, 45,414.98 ha, and 39,547.46 ha, respectively. In the year 2019, it is observed that those districts still had a large area in comparison to other districts based on their mean values, i.e., Waan, Ulilin, Kimaam, and Muting. However, Ulilin, Kimaam, and Muting gradually decreased the land area by around 1.69 ha to 451.68 ha throughout the study. In contrast, Waan district extended the area by approximately 899.53 ha. Semangga, Malind, Kurik, and Naukenjerai still had an inadequate site according to their mean value, and overall, the area progressively declined during the study period.
Statistical analyses using paired t-test were carried out on data generated from supervised classification-based restricted by remote sensing images of the study area. Specifically, the potential habitat of the sago palm is shown in Table 8. The result of the paired samples t-test (Table 8) demonstrates that the p-value is less than 0.05 for primary dryland (p-value = 0.015), grassland (p-value = 0.002) and swamp (p-value = 0.007). Other categories are greater than 0.05, namely, secondary dryland, primary swamp forest, secondary swamp forest, bush/shrub, and swamp shrub. Therefore, the result reveals that primary dryland forest, grassland, and swamp experienced a statistically significant change from 1990 to 2019.
4. Discussion
We used the Landsat satellite imagery and supervised classification to develop recent land cover changes in Merauke Regency over the past 29-year period (Figure 3). The land cover of this Regency today consists of six classes of the natural forest and fifteen classes of non-forested areas. The result from this study showed that a land cover map of Merauke Regency is now generally dominated by non-forested regions, followed by natural forests. Concerning the proportion of natural versus non-forest regions (Figure 4), it is shown that, in 1990, the percentage of the natural forested landscape was 49.70%; however, in 2019, it declined by 7.33%. In the opposite category, the non-forested area was about 49.70% in 1990 and then expanded in 2019, approximately by 57.03%. During this study period, we found two classes of non-forest land cover that extended to up to 100% in terms of total area and the percentage of change, i.e., settlement area and paddy field; 124%, 316.26%, respectively (Table 6). The land area changes also explain why Merauke Regency nowadays is the largest producer of paddy commodities by around 91.47% over Papua Province [49,50]. The settlement area was naturally expanding, expressing population growth in this Regency. Inversely, two other classes of non-forest, for instance water body and transmigration area, had slightly decreased around 0.61% and 30.20% (Table 6). The increment of built-up areas can bea result of migration or urban growth and may lead to environmental problems such as degradation in vegetation and water bodies [59].
In this study, the natural forest cover consists of primary dryland, secondary dryland, primary mangrove, secondary mangrove, primary swamp, and secondary swamp forest. Our evidence confirmed that primary swamp forest and primary dryland forest had higher area losses compared to other forest types, such as primary mangrove, or secondary mangrove. As shown in Table 6, the primary dryland forest lost about 27.98%. Meanwhile, secondary dryland forest, primary mangrove forest, and secondary mangrove forest lost around 1.06%, 6.39%, and 5.07%, respectively. Only the secondary swamp forest gained about 0.03% during the study period. Decrement of the forested landscape was also experienced by some European countries due to increased temperatures caused by climate change. In the Czech Republic, the forest area is currently diminished because of the bark beetle attack [60,61]. Most of the Czech forests are productive forests with less-diverse trees [62]. Therefore, to restore the forested landscape, it is suggested to cultivate various plants with different ages of trees and appropriate width stands of the trees in the Czech forests to provide a natural interconnection in the food chain or food web, to reduce the damage caused by insect attacks [63,64]. The challenge can be taken as a lesson learned, and the recommendations can also be adopted for forest management and restoration in Merauke Regency.
In contrast, the agricultural sector, such as dryland agriculture, mix dryland farms, gained from around 50% to 57% of the land cover area in Merauke Regency (Table 6), which is in agreement with the previous notion that agricultural development can be a threat to the sustainability of mangrove forest in Papua [46].Nevertheless, the mangrove environment can support ecological and economic services to neighborhood, society, and also in the country [65]. Another class of natural forest that suffered in terms of the percentage of change was primary swamp forest; this class lost area by around 40.95% during the study period. This phenomenon can lead directly to a decreased forest quality such as loss of plants that live ecologically in this area, for instance, sago palm (Metroxylon sago Rottb) (Table 1) [45]. It also refers to previous studies that found sago palm raising well in particular ecosystems, for example, swamp forest, peat soil, saline [19].
Moreover, sago forests have the opportunity of excellent carbon sinks for carbon absorption, reducing the greenhouse impact and global warming [66]. The wetlands changes and the effect on biodiversity are also acquainted by East African countries such as Tanzania [12]; the number of native species, for instance, woody plant species, bird species, have declined due to some reasons such as deforestation, agricultural expansion, and the extension of the settlement area. Deforestation in peat swamp areas is also experienced by Malaysia [67]; it mentioned that swamp forests declined mostly as the result of the transformation to other non-forested regions such as the agriculture sector. In Papua, sago is believed to be one of the natural resources which can enhance the needs of communities such as to support households’ low energy consumption [47] and to strengthen food security as a staple food [68]. Therefore, more preventive approaches, such as regulation or desertification programs from the local government or relevant stakeholders, are highly required.
Other natural ecosystems of sago palm, as estimated in the peatland ecosystem [45], were dryland, bush/shrub, grassland, swamp shrub, and swamp. We analyzed these areas in twenty districts of Merauke Regency by using paired t-test (Table 7 and Table 8). Based on the mean values, our findings confirmed that 12 districts from 20 districts of Merauke Regency lost the natural habitat of sago palm, namely, Elikobel (mean = 17,495.36), Jagebob (mean = 15,082.23), Kurik (mean = 7971.55), Kaptel (mean = 27,699.84), Kimaam (mean = 45,413.29), Malind (mean = 4883.73), Muting (mean = 39,489.52), Naukenjerai (mean = 9737.45), Ngguti (mean = 38,816.99), Tanah Miring (mean = 16,359.38), Tabonji (mean = 33,030.82), and Ulilin (mean = 56,017.52) (Table 7). Only one district remained unchanged, i.e., Semangga, thus, seven districts increased slightly, specifically Animha (mean = 16,983.27), Ilwayab (mean = 21,900.72), Merauke (mean = 15,126.20), Okaba (mean = 18,900.30), Sota (mean = 30,931.49), Tubang (mean = 32,655.19) and Waan (mean = 61,382.05). Waan had the largest potential of sago palm area in Merauke Regency.
To add to this, we analyzed the natural habitat of sago palm in eight possible ecosystems from land cover changes in 20 districts of Merauke Regency, especially primary dryland, secondary dryland, primary swamp forest, secondary swamp forest, bush/shrub, grassland, swam shrub, and swamp. Based on land cover losses and gains (Table 6), the peatland ecosystem gained in the area of bush/shrub (+79.95%), swamp shrub (+1.39%), swamp (+10.94%), savanna/grassland (+17.72%), and secondary swamp forest (+0.03%). However, this regency lost the peatland area mostly at primary swamp (−40.95%), primary dryland (−27.98%), and secondary dryland (−1.06%) from 1990 to 2019. Nevertheless, the decreasing trend of the natural forest seems to be broke out in 2019. It can be seen in Figure 4 that the area of natural forest has increased by around 3.5% compared to the previous year. This circumstance could be achieved through support by some strategic plans from the Indonesian Government such as the Peat Restoration Agency or Badan Restorasi Gambut (B.R.G.), the mitigation of forest, land fires, and forest evaluation. The Peat Restoration Agency takes a responsibility to restore peat lands ecosystem in several provinces including Papua [16,17]. The forest restoration is expected to be continued in the coming years. In this respect, the annual land cover maps on this site are required by the region, as well as on a national scale, to monitor and to evaluate particular habitat; since the habitat is damaged overtime, Indonesia will suffer from the loss of various natural plants [43,69]. Moreover, the outcomes of the paired sample t-test as presented in Table 8 reports that primary dryland (p-value = 0.015), grassland (p-value = 0.002) and swamp (p-value = 0.007) significantly changed statistically. The area of primary dryland seems to have decreased; however, swamp and grassland have increased in the statistical term.
On the other hand, this study has not compared the trend of sago palm over time, due to the lack of supporting data, especially the area of sago palm in this site. Therefore, the yield estimation or calculation of this plant in this particular area should be considered annually produced. This study recommends further research in terms of detecting and recognizing the sago palm in this specific area of Merauke Regency.
5. Conclusions
The study has produced recent land cover maps and examined the spatial temporal patterns and rate of land cover changes in Merauke Regency from 1990 to 2019 using remote sensing techniques and supervised classification. Merauke land cover consists of twenty-one classes, which are classified into six classes of natural forest and fifteen classes of non-forested areas. Our analysis of the land cover map presented that the largest declines mostly occurred in the natural forest, namely primary dryland forest, secondary dryland forest, primary mangrove, secondary mangrove, primary swamp forest, for about −81.45% altogether, and only secondary swamp forest has slightly increased by about 0.03% over time. According to the natural habitat of the sago palm, we evaluated eight possible ecosystems, namely, dryland, bush/shrub, grassland, swamp shrub, swamp, and swamp forest, using paired sample t-test. The result indicated statistically significant changes specifically at primary dryland (p-value = 0.015), grassland (p-value = 0.002), and swamp (p-value = 0.007). We also analyzed these areas in twenty districts of Merauke Regency. Our findings confirmed that 12 districts from 20 districts of Merauke Regency tend to lose the natural habitat of the sago palm, while only one district remains unchanged. Nonetheless, these particular ecosystems are beneficial to support local community life; for example, planting and harvesting sago palm. Therefore, these outcomes could be integrated within decision-makers and stakeholders to evaluate and to establish government development plans.
Author Contributions
Conceptualisation, methodology, validation, S.M.A.L., R.C.P., and D.H.; software, S.M.A.L., F.R., and R.C.P.; formal analysis, S.M.A.L. and R.C.P.; investigation, S.M.A.L. and F.R.; resources, D.H.; writing—original draft preparation, S.M.A.L., R.C.P., and D.H.; writing—review and editing, S.M.A.L., R.C.P., and D.H.; visualization, S.M.A.L. and F.R.; supervision, D.H. and R.C.P.; project administration, D.H.; funding acquisition, D.H. All authors have read and agreed to the published version of the manuscript.
Funding
This study is part of on-going research being undertaken for PhD work of the first author. The first author is deeply grateful to the Indonesia Endowment Fund for Education (LPDP-Indonesia) for funding and supporting her PhD study. R.C.P. is also supported by grant EVA 4.0 No. CZ.02.1.01/0.0/0.0/16_019/0000803, financed by the OPRDE-Ministry of Education of the Czech Republic.
Acknowledgments
All the authors would like to thank the Ministry of Environment and Forestry (MoEF) of Indonesiafor granting existing land cover maps of Merauke Regency as well as the boundary map. We are also thankful tothe Provincial Development Planning Agency of Papua for providing an additional provincial boundary map. We appreciate the assistance of Meryem Tahri, during idea development, Julia V. Latul and Bambang A. Nugroho (Forestry Office of Merauke Regency) for sharing the peatland LULC map data, and Jitka Kumhalova, for peer reviewing the earlier draft of the manuscript. We are also grateful to our anonymous reviewers, editor, whose comments and suggestions improved the manuscript.
Conflicts of Interest
The authors declare no conflict of interest.
References
- Guo, Y.; Fang, G.; Xu, Y.-P.; Tian, X.; Xie, J. Identifying how future climate and land use/cover changes impact streamflow in Xinanjiang Basin, East China. Sci. Total Environ. 2020, 710, 136275. [Google Scholar] [CrossRef]
- Halmy, M.W.A.; Gessler, P.E.; Hicke, J.A.; Salem, B.B. Land use/land cover change detection and prediction in the north-western coastal desert of Egypt using Markov-CA. Appl. Geogr. 2015, 63, 101–112. [Google Scholar] [CrossRef]
- Whittle, M.; Quegan, S.; Uryu, Y.; Stüewe, M.; Yulianto, K. Detection of tropical deforestation using ALOS-Palsar: A Sumatran case study. Remote. Sens. Environ. 2012, 124, 83–98. [Google Scholar] [CrossRef]
- Aliani, H.; Malmir, M.; Sourodi, M.; Kafaky, S.B. Change detection and prediction of urban land use changes by CA–Markov model (case study: Talesh County). Environ. Earth Sci. 2019, 78, 546. [Google Scholar] [CrossRef]
- Cheng, K.; Wang, J. Forest type classification based on integrated spectral-spatial-temporal features and random forest algorithm—A case study in the qinling mountains. Forests 2019, 10, 559. [Google Scholar] [CrossRef]
- Tripathy, P.; Kumar, A. Monitoring and modelling spatio-temporal urban growth of Delhi using cellular automata and geoinformatics. Cities 2019, 90, 52–63. [Google Scholar] [CrossRef]
- Hamad, R.; Balzter, H.; Kolo, K. Predicting land use/land cover changes using a CA-markov model under two different scenarios. Sustainability 2018, 10, 3421. [Google Scholar] [CrossRef][Green Version]
- Anand, V.; Oinam, B. Future land use land cover prediction with special emphasis on urbanization and wetlands. Remote Sens. Lett. 2020, 11, 225–234. [Google Scholar] [CrossRef]
- Wu, Z.; Dai, E.; Wu, Z.; Lin, M. Future forest dynamics under climate change, land use change, and harvest in subtropical forests in Southern China. Landsc. Ecol. 2019, 34, 843–863. [Google Scholar] [CrossRef]
- Saragi-Sasmito, M.F.; Murdiyarso, D.; June, T.; Sasmito, S.D. Carbon stocks, emissions, and aboveground productivity in restored secondary tropical peat swamp forests. Mitig. Adapt. Strateg. Glob. Chang. 2019, 24, 521–533. [Google Scholar] [CrossRef][Green Version]
- Zhao, M.; He, Z. Evaluation of the effects of land cover change on ecosystem service values in the upper reaches of the heihe river basin, northwestern China. Sustainability 2018, 10, 4700. [Google Scholar] [CrossRef][Green Version]
- Seki, H.A.; Shirima, D.D.; Courtney Mustaphi, C.J.; Marchant, R.; Munishi, P.K.T. The impact of land use and land cover change on biodiversity within and adjacent to Kibasira Swamp in Kilombero Valley, Tanzania. Afr. J. Ecol. 2018, 56, 518–527. [Google Scholar] [CrossRef]
- Obidzinski, K.; Takahashi, I.; Dermawan, A.; Komarudin, H.; Andrianto, A. Can large scale land acquisition for agro-development in Indonesia be managed sustainably? Land Use Policy 2013, 30, 952–965. [Google Scholar] [CrossRef]
- Acosta, P.; Curt, M.D. Understanding the expansion of oil palm cultivation: A case-study in Papua. J. Clean. Prod. 2019, 219, 199–216. [Google Scholar] [CrossRef]
- Sloan, S.; Campbell, M.J.; Alamgir, M.; Engert, J.; Ishida, F.Y.; Senn, N.; Huther, J.; Laurance, W.F. Hidden challenges for conservation and development along the Trans-Papuan economic corridor. Environ. Sci. Policy 2019, 92, 98–106. [Google Scholar] [CrossRef]
- Cabinet Secretariat of the Republic of Indonesia. Available online: https://setkab.go.id/en/president-jokowi-establishes-peat-land-restoration-agency-brg/ (accessed on 9 June 2020).
- Cabinet Secretariat of the Republic of Indonesia. Available online: https://setkab.go.id/en/president-jokowi-signs-presidential-instruction-on-forest-land-fires-mitigation/ (accessed on 8 June 2020).
- Ehara, H.; Toyoda, Y.; Johnson, D.V. (Eds.) Sago Palm: Multiple Contributions to Food Security and Sustainable Livelihoods; Springer: Singapore, 2018; ISBN 978-981-10-5268-2. [Google Scholar]
- Zhu, F. Recent advances in modifications and applications of sago starch. Food Hydrocoll. 2019, 96, 412–423. [Google Scholar] [CrossRef]
- Singhal, R.S.; Kennedy, J.F.; Gopalakrishnan, S.M.; Kaczmarek, A.; Knill, C.J.; Akmar, P.F. Industrial production, processing, and utilization of sago palm-derived products. Carbohydr. Polym. 2008, 72, 1–20. [Google Scholar] [CrossRef]
- Karim, A.A.; Tie, A.P.-L.; Manan, D.M.A.; Zaidul, I.S.M. Starch from the Sago (Metroxylonsagu) palm treeproperties, prospects, and challenges as a new industrial source for food and other uses. Compr. Rev. Food Sci. Food Saf. 2008, 7, 215–228. [Google Scholar] [CrossRef]
- Yan, E.; Zhao, Y.; Lin, H.; Wang, G.; Mo, D. Improving the estimation of forest carbon density in mountainous regions using topographic correction and landsat 8 images. Remote Sens. 2019, 11, 2619. [Google Scholar] [CrossRef][Green Version]
- Poortinga, A.; Tenneson, K.; Shapiro, A.; Nquyen, Q.; San Aung, K.; Chishtie, F.; Saah, D. Mapping plantations in myanmar by fusing landsat-8, sentinel-2 and sentinel-1 data along with systematic error quantification. Remote Sens. 2019, 11, 831. [Google Scholar] [CrossRef][Green Version]
- Xing, L.; Niu, Z. Mapping and analyzing China’s wetlands using MODIS time series data. Wetl. Ecol. Manag. 2019, 27, 693–710. [Google Scholar] [CrossRef]
- Richard Allen, T.; Wang, Y.; Gore, B. Coastal wetland mapping combining multi-date SAR and LiDAR. Geocarto Int. 2013, 28, 616–631. [Google Scholar] [CrossRef]
- Flores-Casas, R.; Ortega-Huerta, M.A. Modelling land cover changes in the tropical dry forest surrounding the Chamela-Cuixmala biosphere reserve, Mexico. Int. J. Remote Sens. 2019, 40, 6948–6974. [Google Scholar] [CrossRef]
- Wang, D.; Wan, B.; Qiu, P.; Su, Y.; Guo, Q.; Wu, X. Artificial mangrove species mapping using pléiades-1: An evaluation of pixel-based and object-based classifications with selected machine learning algorithms. Remote Sens. 2018, 10, 294. [Google Scholar] [CrossRef][Green Version]
- Cando-Jácome, M.; Martínez-Graña, A. Determination of primary and secondary lahar flow paths of the fuego volcano (Guatemala) using morphometric parameters. Remote Sens. 2019, 11, 727. [Google Scholar] [CrossRef][Green Version]
- Jakimow, B.; van der Linden, S.; Thiel, F.; Frantz, D.; Hostert, P. Visualizing and labeling dense multi-sensor earth observation time series: The EO time series viewer. Environ. Model. Softw. 2020, 125, 104631. [Google Scholar] [CrossRef]
- Elfadaly, A.; Abouarab, M.A.R.; Shabrawy, R.R.M.E.; Mostafa, W.; Wilson, P.; Morhange, C.; Silverstein, J.; Lasaponara, R. Discovering potential settlement areas around archaeological tells using the integration between historic topographic maps, optical, and radar data in the northern Nile Delta, Egypt. Remote Sens. 2019, 11, 3039. [Google Scholar] [CrossRef][Green Version]
- Gurjar, S.K.; Tare, V. Estimating long-term LULC changes in an agriculture-dominated basin using CORONA (1970) and LISS IV (2013–14) satellite images: A case study of Ramganga River, India. Environ. Monit. Assess. 2019, 191, 217. [Google Scholar] [CrossRef]
- Patel, S.; Shah, E.; Jayaprasad, P.; James, M.E. Changes in Antarctic coastline between 1997 and 2016 using RADARSAT and MODIS data. Int. J. Remote Sens. 2020, 41, 1389–1414. [Google Scholar] [CrossRef]
- Stromann, O.; Nascetti, A.; Yousif, O.; Ban, Y. Dimensionality reduction and feature selection for object-based land cover classification based on sentinel-1 and sentinel-2 time series using Google earth engine. Remote Sens. 2019, 12, 76. [Google Scholar] [CrossRef][Green Version]
- Venter, Z.S.; Scott, S.L.; Desmet, P.G.; Hoffman, M.T. Application of Landsat-derived vegetation trends over South Africa: Potential for monitoring land degradation and restoration. Ecol. Indic. 2020, 113, 106206. [Google Scholar] [CrossRef]
- Zhang, Y.; Zhao, H. Land–use and land-cover change detection using dynamic time warping–based time series clustering method. Can. J. Remote Sens. 2020, 46, 67–83. [Google Scholar] [CrossRef]
- Sajjad, A.; Lu, J.; Chen, X.; Chisenga, C.; Saleem, N.; Hassan, H. Operational monitoring and damage assessment of riverine flood-2014 in the lower chenab plain, punjab, pakistan, using remote sensing and GIS techniques. Remote Sens. 2020, 12, 714. [Google Scholar] [CrossRef][Green Version]
- Fortin, J.A.; Cardille, J.A.; Perez, E. Multi-sensor detection of forest-cover change across 45 years in Mato Grosso, Brazil. Remote Sens. Environ. 2020, 238, 111266. [Google Scholar] [CrossRef]
- Kalther, J.; Itaya, A. Coastline changes and their effects on land use and cover in Subang, Indonesia. J. Coast. Conserv. 2020, 24, 16. [Google Scholar] [CrossRef]
- Anderson, K.; Fawcett, D.; Cugulliere, A.; Benford, S.; Jones, D.; Leng, R. Vegetation expansion in the subnival Hindu Kush Himalaya. Glob. Chang. Biol. 2020, 26, 1608–1625. [Google Scholar] [CrossRef][Green Version]
- Ma, W.; Domke, G.M.; Woodall, C.W.; D’Amato, A.W. Contemporary forest carbon dynamics in the northern U.S. associated with land cover changes. Ecol. Indic. 2020, 110, 105901. [Google Scholar] [CrossRef]
- Tao, S.; Fang, J.; Ma, S.; Cai, Q.; Xiong, X.; Tian, D.; Zhao, X.; Fang, L.; Zhang, H.; Zhu, J.; et al. Changes in China’s lakes: Climate and human impacts. Natl. Sci. Rev. 2019, 7, 132–140. [Google Scholar] [CrossRef][Green Version]
- Rigge, M.; Homer, C.; Cleeves, L.; Meyer, D.K.; Bunde, B.; Shi, H.; Xian, G.; Schell, S.; Bobo, M. Quantifying Western U.S. rangelands as fractional components with multi-resolution remote sensing and in situ data. Remote Sens. 2020, 12, 412. [Google Scholar] [CrossRef][Green Version]
- Uda, S.K.; Hein, L.; Sumarga, E. Towards sustainable management of Indonesian tropical peatlands. Wetl. Ecol. Manag. 2017, 25, 683–701. [Google Scholar] [CrossRef][Green Version]
- MoEF. National Forest Reference Emission Level for Deforestation and Forest Degradation: In the Context of Decision 1/CP.16 para 70 UNFCCC (Encourages Developing Country Parties to Contribute to Mitigation Actions in the Forest Sector); DG-PPI MoEF: New Delhi, India, 2015. [Google Scholar]
- Papua Province. RREG Papua Province 2017–2020; Peatland Restoration Agency: Jakarta, Indonesia, 2017; pp. 1–2. [Google Scholar]
- Sasmito, S.D.; Sillanpää, M.; Hayes, M.A.; Bachri, S.; Saragi-Sasmito, M.F.; Sidik, F.; Hanggara, B.B.; Mofu, W.Y.; Rumbiak, V.I.; Hendri; et al. Mangrove blue carbon stocks and dynamics are controlled by hydrogeomorphic settings and land-use change. Glob. Chang. Biol. 2020, 26, 3028–3039. [Google Scholar] [CrossRef] [PubMed][Green Version]
- Jonatan, N.J.; Ekayuliana, A.; Dhiputra, I.M.K.; Nugroho, Y.S. The Utilization of Metroxylon Sago (Rottb.) dregs for low bioethanol as fuel households needs in Papua Province Indonesia. KLS 2017, 3, 150. [Google Scholar] [CrossRef][Green Version]
- Thangavelu, S.K.; Rajkumar, T.; Pandi, D.K.; Ahmed, A.S.; Ani, F.N. Microwave assisted acid hydrolysis for bioethanol fuel production from sago pith waste. Waste Manag. 2019, 86, 80–86. [Google Scholar] [CrossRef] [PubMed]
- BPS. Papua Province in Figures 2020; BPS-Statistics of Papua Province, BPS: Jakarta, Indonesia, 2020. [Google Scholar]
- BPS. Merauke Regency in Figures 2020; BPS-Statistics of Merauke Regency, BPS: Jakarta, Indonesia, 2020. [Google Scholar]
- Leinenkugel, P.; Deck, R.; Huth, J.; Ottinger, M.; Mack, B. The potential of open geodata for automated large-scale land use and land cover classification. Remote Sens. 2019, 11, 2249. [Google Scholar] [CrossRef][Green Version]
- Alonso-Sarria, F.; Valdivieso-Ros, C.; Gomariz-Castillo, F. Isolation forests to evaluate class separability and the representativeness of training and validation areas in land cover classification. Remote Sens. 2019, 11, 3000. [Google Scholar] [CrossRef][Green Version]
- Gilani, H.; Shrestha, H.L.; Murthy, M.S.R.; Phuntso, P.; Pradhan, S.; Bajracharya, B.; Shrestha, B. Decadal land cover change dynamics in Bhutan. J. Environ. Manag. 2015, 148, 91–100. [Google Scholar] [CrossRef]
- Jeong, S.; Ko, J.; Yeom, J.-M. Nationwide projection of rice yield using a crop model integrated with geostationary satellite imagery: A case study in South Korea. Remote Sens. 2018, 10, 1665. [Google Scholar] [CrossRef][Green Version]
- Ye, S.; Rogan, J.; Sangermano, F. Monitoring rubber plantation expansion using Landsat data time series and a Shapelet-based approach. ISPRS J. Photogramm. Remote Sens. 2018, 136, 134–143. [Google Scholar] [CrossRef]
- Gondwe, M.F.; Cho, M.A.; Chirwa, P.W.; Geldenhuys, C.J. Land use land cover change and the comparative impact of co-management and government-management on the forest cover in Malawi (1999–2018). J. Land Use Sci. 2019, 14, 281–305. [Google Scholar] [CrossRef]
- Entwistle, C.; Mora, M.A.; Knight, R. Estimating coastal wetland gain and losses in Galveston County and Cameron County, Texas, USA: Wetland Gains and Losses in 2 Texas Coastal Counties. Integr. Environ. Assess. Manag. 2018, 14, 120–129. [Google Scholar] [CrossRef][Green Version]
- Martínez, M.L.; Pérez-Maqueo, O.; Vázquez, G.; Castillo-Campos, G.; García-Franco, J.; Mehltreter, K.; Equihua, M.; Landgrave, R. Effects of land use change on biodiversity and ecosystem services in tropical montane cloud forests of Mexico. Forest Ecol. Manag. 2009, 258, 1856–1863. [Google Scholar] [CrossRef]
- Mathan, M.; Krishnaveni, M. Monitoring spatio-temporal dynamics of urban and peri-urban land transitions using ensemble of remote sensing spectral indices—A case study of Chennai Metropolitan Area, India. Environ. Monit. Assess. 2020, 192, 15. [Google Scholar] [CrossRef]
- Holusa, J.; Lubojacky, J.; Knizek, M. Distribution of the double-spined spruce bark beetle Ipsduplicatus in the Czech Republic: Spreading in 1997–2009. Phytoparasitica 2010, 38, 435–443. [Google Scholar] [CrossRef][Green Version]
- Purwestri, R.C.; Hájek, M.; Šodková, M.; Sane, M.; Kašpar, J. Bioeconomy in the National Forest Strategy: A comparison study in Germany and the Czech Republic. Forests 2020, 11, 608. [Google Scholar] [CrossRef]
- Food and Agriculture Organization of the United Nations (FAO) Global Forest Resources Assessment 2015: Desk Reference. 2017. Available online: http://www.fao.org/forest-resources-assessment/past-assessments/fra-2015/en/ (accessed on 9 August 2019).
- Martin, K.; Norris, A.; Drever, M. Effects of bark beetle outbreaks on avian biodiversity in the British Columbia interior: Implications for critical habitat management. JEM 2006, 7, 10–24. [Google Scholar]
- Bentz, B.; Logan, J.; MacMahon, J.; Allen, C.D.; Ayres, M.; Berg, E.; Carroll, A.; Hansen, M.; Hicke, J.; Joyce, L.; et al. Bark beetle outbreaks in western North America: Causes and consequences. In Bark Beetle Symposium; Snowbird, Utah; November, 2005; University of Utah Press: Salt Lake City, UT, USA, 2009. [Google Scholar]
- Zhang, X.; Treitz, P.M.; Chen, D.; Quan, C.; Shi, L.; Li, X. Mapping mangrove forests using multi-tidal remotely-sensed data and a decision-tree-based procedure. Int. J. Appl. Earth Obs. Geoinf. 2017, 62, 201–214. [Google Scholar] [CrossRef]
- Chew, T.A.; Isa AH, B.M.; Mohayidin, M.G.B. Sago (MetroxylonsaguRottboll, the forgotten palm. J. Sustain. Agric. 1999, 14, 5–17. [Google Scholar] [CrossRef]
- Kamlun, K.U.; Bürger Arndt, R.; Phua, M.-H. Monitoring deforestation in Malaysia between 1985 and 2013: Insight from South-Western Sabah and its protected peat swamp area. Land Use Policy 2016, 57, 418–430. [Google Scholar] [CrossRef]
- Salosa, S.T. Challenge of Sago (MetroxylonSp) as Papua Food Identity. KSS 2016, 1, 62–65. [Google Scholar] [CrossRef][Green Version]
- Vetrita, Y.; Cochrane, M.A. Fire frequency and related land-use and land-cover changes in indonesia’s peatlands. Remote Sens. 2019, 12, 5. [Google Scholar] [CrossRef][Green Version]
3.5. Supplementary Materials
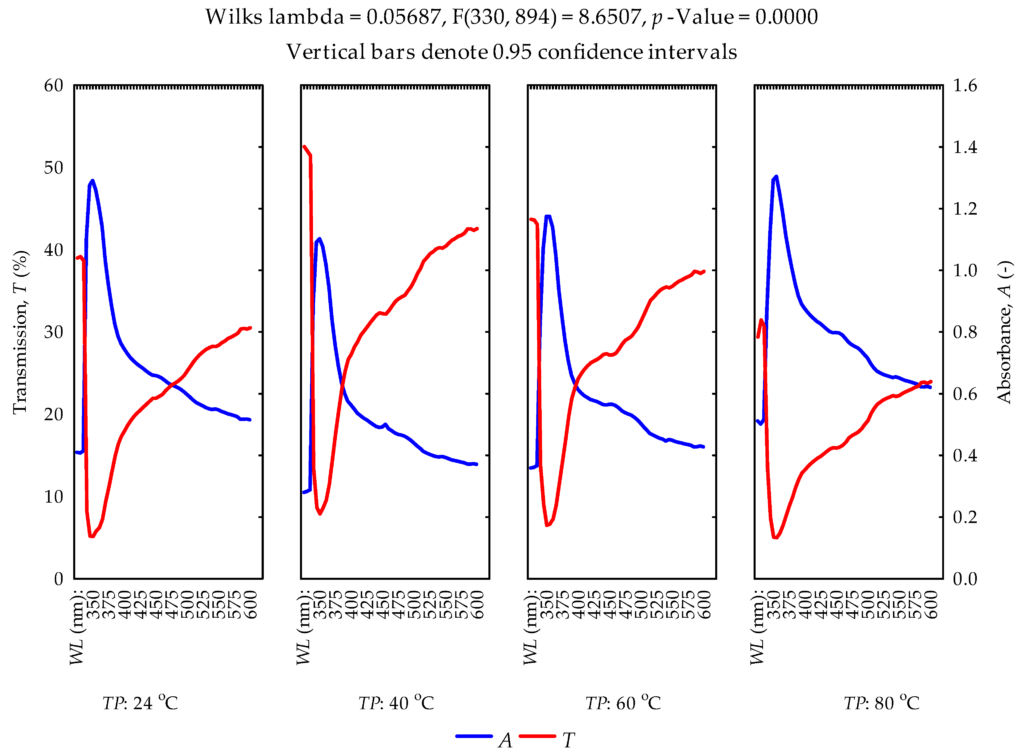
The descriptive statistics (means, standard deviations and standard errors) of the effect of heating temperatures (40, 60 and 80 °C) on the absorbance and transmittance rates in the wavelength range from 325 to 600 nm are provided (Table S1). The scatterplots of the absorbance and transmittance versus wavelength at a specific heating temperature correlated both negatively (r = −0.558) and positively (r = 0.494) (Figures S1 and S2). On the contrary, the scatterplots of the absorbance and transmittance versus temperature at a specific wavelength correlated positively (r = 0.198) and negatively (r = −0.232) (Figures S3 and S4). It can be stated that the heating temperatures had a significant effect on the absorbance and transmittance rates of hulled sunflower seeds oil samples.
4. Discussion
The purpose of this study was to estimate the maximum oil recovery efficiency and residual oil from hulled sunflower bulk seeds and press cakes at various temperatures (24 °C, 40 °C, 60 °C and 80 °C) in the uniaxial compression process. The corresponding energies were calculated. In addition, the extracted oil samples were evaluated in terms of physicochemical properties (moisture content, peroxide value, acid value and free fatty acid) and UV spectral curves (absorbance and transmittance in the wavelength range of 325–600 nm). To extract the oil, the maximum load of 40 kN corresponding to a pressure of 14.147 MPa (ratio of force to the area of pressing vessel) was combined with a pressing speed of 4 mm/min for an initial sample pressing height of 60 mm using the vessel diameter of 60 mm. Here the sample volume of 16.965 × 10⁻⁵ m3 was calculated (Equation (4)). The maximum preset load was determined from a preliminary test, where the force–deformation curve at 60 kN showed a serration pattern characterized by the ejection of the seedcake through the bottom holes of the pressing vessel. According to Divisova et al. [22], the maximum oil yield from oilseed samples is attained under the curve without the serration effect. Based on the compression data obtained, the parameters, namely, oil yield, oil expression efficiency and energy, were calculated with the varied pressings at heights of 60 mm to 30 mm (samples volume in the range of 14.137 × 10⁻⁵ m3 to 8.482 × 10⁻⁵ m3); heating temperatures of 40, 60 and 80 °C; and a control temperature of 24 °C (unheated sample).
For samples at an initial pressing height of 60 mm against temperature, the oil yield and/or oil expression efficiency increased along with the increase in heating temperatures. An energy increment was realized for heating temperatures between 24 °C and 60 °C but declined at 80 °C. This meant that at a heating temperature of 80 °C, a higher oil recovery efficiency of 44.545 ± 1.489% was found with a lower energy demand of 196.548 ± 1.426 J in comparison with a heating temperature of 60 °C, which gave a lower oil recovery efficiency of 42.759 ± 0.305% but with a higher energy requirement of 209.032 ± 13.975 J. With repeated pressings at heights of 50 mm to 30 mm with the temperatures, all the determined parameters decreased in amounts because of the first pressing, which was initiated at 60 mm of height. However, it was observed that without the repeated pressing from the first pressing, a considerable amount of oil would have remained in the press/seedcake. Here, the total residual oil yield amounts obtained at all temperatures were 32.145 ± 5.673%, 21.168 ± 2.551%, 18.537 ± 1.013% and 16.810 ± 2.722%, respectively. The corresponding energy values were 377.012 ± 60.596 J, 432.458 ± 29.606 J, 421.403 ± 36.647 J and 391.385 ± 13.757 J. This result indicates that more residual oil with a minimum energy input is thus obtained from the sample temperature of 24 °C without the heat treatment compared to the samples with heat treatment. This agreed with the cumulative amounts of all the pressings carried out (initial pressing combined with the repeated pressings). Nevertheless, a higher energy demand was required to recover the residual oil in the press cake than the maximum oil yield obtained from the bulk oilseeds at the initial/first pressing of 60 mm for the varied temperatures (Table 1). The present results agree with the findings of Karaj and Muller [20], Khan and Hanna [56] and Li et al. [57], cited in Deng et al. [58], who indicated that lower energy input results in lower oil recovery efficiency, leading to higher oil residue in press cake and higher seed material throughput; oil yield of cottonseeds increased from 13.0 to 24.2% as the temperature increased from 18 °C to 125 °C, and oil yield for peony seeds increased at a temperature of 73 °C and moisture content of 4.6% under a pressure of 4.6 MPa and feed rate of 1600 g/min.
For the physicochemical properties of the extracted oil samples, the moisture content is an indirect measure of the oil’s quality and resistance to thermal oxidation [59]. Hoffmann [60] and Reuber [61] suggested that lower moisture content of oilseeds increases friction, whereas higher moisture content acts as a lubricant. Although higher oil recovery could be achieved at a lower moisture content, in the case of screw pressing it is not advisable to press oilseeds below a moisture content of 3.6% due to plugging [62]. Heat pretreatment of oilseeds is usually done to induce higher oil yield, which thus affects the oil quality [62]. In this study, the oil quality parameters, namely, the peroxide value (PV), acid value (AV) and free fatty acid (FFA) were determined at different heating temperatures (40 °C, 60 °C and 80 °C) and compared to the control temperature of 24 °C. The peroxide value increased from 6.898 ± 0.144 to 7.290 ± 0.507 meq O2/kg at temperatures of 24 °C to 60 °C but decreased at 80 °C. The acid value and free fatty acid (mg KOH/g oil) increased up to 40 °C but decreased at 60 °C and then increased at 80 °C. However, the increment at 80 °C was lower than at 40 °C and higher than at 24 °C (Table 6). The extracted oil samples were not significantly (p > 0.05) affected by the heating temperatures. Choo et al. [63], cited in Herchi et al. [29], reported that during heating there is an accumulation of peroxides. Konuskan et al. [42] mentioned that high temperature, visible light and oxygen can easily increase the peroxide value of the oils. Herchi et al. [29] also indicated PV, AV and FFA values of hull flaxseed oil extracted at 110 °C for 12 h. The authors published PV values between 1.85 ± 0.08 and 5.2 ± 0.15 meq O2/kg oil, the AV values between 1.5 ± 0.14 and 2.9 ± 0.25 mg KOH/g oil and the FFA values between 0.9 ± 0.06 and 1.7 ± 0.10% oleic acid. The authors further indicated that the increase in PV values showed that the oil was unstable due to oxidative degradation. On the other hand, heating caused an increase in AV, whereas the FFA increase could be attributed to oxidation and hydrolysis that produce FFAs. Adeyanju et al. [34] reported FFA values in the range of 5.34 and 1.86% for coconut oil at temperatures between 60 and 120 °C and roasting time between 5 and 30 min. The authors stated that FFAs decreased with a decrease in roasting temperature and time. Ajai et al. [64] published the above-mentioned properties of selected vegetable oils (groundnut, soybean, palm oil and palm kernel oil) at laboratory temperatures. Their results for PV ranged from 1.90 ± 0.30 to 6.97 ± 0.41 meq O2/kg oil and AV ranged from 0.42 ± 0.03 to 1.13 ± 0.21 mg NaOH/g. For refined sunflower oil, 0.13% equivalent in oleic acid has been reported [65]. According to the Codex Alimentarius [44] and Eke-Ejiofor et al. [66], the permissible levels of peroxide values for virgin oils and cold pressed fats and oils is up to 15 milliequivalents of active oxygen/kg oil, and for other fats and oils is up to 10 milliequivalents of active oxygen/kg oil; the acid value for refined fats and oils is 0.6 mg KOH/g fat or oil, for virgin fats and oils is 4.0 mg KOH/g fat or oil and for cold pressed fats and oils is 4.0 mg KOH/g fat or oil, and FFA of 0.6%. FFA is half the AV [67].
The absorbance and transmittance curves of the extracted oil samples at different temperatures within the wavelength range of 325–600 nm were described (Figure 7). The increase in heating temperature increased the absorption rate. The refraction/inverse of the absorbance is the transmittance or vice versa [68]. In the study by Kumar and Viswanathan [12], the authors reported UV absorption and transmittance spectra of selected vegetable oils, namely, mustard oil, sesame oil, neem oil, coconut oil, castor oil and groundnut oil, as well as cod liver oil and chicken oil in the wavelength range of 200–400 nm. The authors indicated that most of the oils showed poor absorption in the UVB region (280–320 nm), while others showed a moderate absorption rate, but chicken oil showed high absorption. In addition, the authors observed transmission rates between 20 and 100% in all the oils they studied. This study, however, observed an absorption peak at 350 nm for all temperatures, which suggests that the oils may contain the natural pigment molecules chlorophyll and carotenoid, belonging to porphyrins and terpenoids [69,70]. Ref. [70] further indicated that β carotene and chlorophyll were the major factors that caused the difference in absorption spectra. The absorption and transmission rates were between 0.28 and 1.305 (-) and 5 and 52.53%, respectively. The differences in comparison with the above-mentioned study [12] could be due to the oil type used and the heating pretreatment. The experimental data (means, standard deviations and standard errors) are provided in the Supplementary Material. Statistically, the standard deviation is a measure of spread and variability, whereas the standard error is a measure of the precision of the sample mean [71]. The more spread out the data distribution, the higher the standard deviation and vice versa. The smaller values of the standard deviation and standard error show the reliability of the mean and thus explain the normal distribution of the data at a 95% confidence interval.
5. Conclusions
Samples of hulled bulk sunflower seeds subjected to various heating temperatures of 40 °C, 60 °C and 80 °C together with an unheated sample temperature of 24 °C were examined for high percentage oil yield and/or oil expression efficiency with a minimum energy requirement under a uniaxial compression process using a pressing vessel of diameter 60 mm under a load of 40 kN and speed of 4 mm/min. After the first/initial pressing at a height of 60 mm (sample volume of 16.965 × 10⁻⁵ m3); repeated pressings at heights from 50 mm to 30 mm (sample volume in the range of 14.137 × 10⁻⁵ m3 to 8.482 × 10⁻⁵ m3) were done to recover the residual oil remaining in the press/seedcake by applying the same load and speed for each pressing. The first pressing produced a minimum oil yield, leaving a considerable amount of the residual oil in the sample press cake. Heating the samples enhanced the oil recovery; however, maximum oil yield was obtained at the fifth repeated pressing. Cumulatively, oil yields of 48.869 ± 1.466%, 44.689 ± 1.296%, 42.523 ± 0.510% and 41.798 ± 1.887% were obtained for the heating temperatures and the control temperature, respectively. The heating temperatures compared to the control temperature had no significant effect (p < 0.05) on the chemical properties of the oil samples (peroxide value, acid value and free fatty acid), which were within the recommended limit for edibility. A single absorption peak was observed at 350 nm for all the oil samples indicating low levels of pigment molecules (chlorophyll and carotenoids) in the oil. The absorption and transmission rates were, respectively, between 0.280 ± 0.026 and 1.305 ± 0.035 and from 5.200 ± 0.346 to 52.533 ± 3.002%, indicating the possible use of sunflower oil as a skin softener against ultraviolet radiation. Future studies could examine unhulled bulk sunflower seeds and other bulk oilseeds to obtain adequate information on the uniaxial oil extraction process towards improving the mechanical screw pressing operation. In addition, appropriate analytical tools such as FT-IR spectroscopy combined with multivariate statistical techniques could be employed to characterize the oil samples concerning the pretreatment conditions.
Supplementary Materials
The following supporting information can be downloaded at: https://www.mdpi.com/article/10.3390/foods11182866/s1, Table S1: Descriptive statistics of the effect of the factors on absorbance and transmittance, Figure S1: Scatterplot of absorbance versus wavelength at 95% confidence interval, Figure S2: Scatterplot of transmittance versus wavelength at 95% confidence interval, Figure S3: Scatterplot of absorbance versus temperature at 95% confidence interval and Figure S4: Scatterplot of transmittance versus temperature at 95% confidence interval.
Author Contributions
Conceptualization. A.K., D.H. and Č.M.; Funding acquisition. D.H.; Methodology. A.K., D.H. and Č.M.; Validation. A.K.; Formal analysis. A.K.; Data curation. A.K. and Č.M.; Writing—original draft. A.K.; Writing—review and editing. A.K.; D.H. and Č.M. All authors have read and agreed to the published version of the manuscript.
Funding
The study was supported by the Internal Grant Agency of Czech University of Life Sciences Prague, Grant Number: IGA 2020: 31130/1312/2114.
Institutional Review Board Statement
Not applicable.
Informed Consent Statement
Not applicable.
Data Availability Statement
The data presented in this study are available upon request from the corresponding author.
Conflicts of Interest
The authors declare no conflict of interest.
References
- Stevenson, D.G.; Eller, F.J.; Wang, L.; Jane, J.L.; Inglett, G.E. Oil and Tocopherol content and composition of pumpkin seed oil in 12 cultivars. J. Agric. Food Chem. 2007, 55, 4005–4013. [Google Scholar] [CrossRef] [PubMed]
- Chatepa, L.E.C.; Uluko, H.; Masamba, K. Comparison of oil quality extracted from selected conventional and non conventional sources of vegetable oil from Malawi. Afr. J. Biotechnol. 2019, 18, 171–180. [Google Scholar]
- Gotor, A.A.; Rhazi, L. Effects of refining process on sunflower oil minor components: A review. OCL 2016, 23, D207. [Google Scholar] [CrossRef]
- Teixeira, M.R.; Nogueira, R.; Nunes, L.M. Quantitative assessment of the valorization of used cooking oils in 23 countries. Waste Manag. 2018, 78, 611–620. [Google Scholar] [CrossRef]
- Mitrea, L.; Teleky, B.-E.; Leopold, L.-F.; Nemes, S.-A.; Plamada, D.; Dulf, F.V.; Pop, I.-D.; Vodnar, D.C. The physicochemical properties of five vegetable oils exposed at high temperature for a short-time-interval. J. Food Compost. Anal. 2022, 106, 104305. [Google Scholar] [CrossRef]
- Ng, T.-T.; So, P.K.; Zheng, B.O.; Yao, Z.-P. Rapid screening of mixed edible oils and gutter oils by matrix-assisted laser desorption/ionization mass spectrometry. Anal. Chim. Acta 2015, 884, 70–76. [Google Scholar] [CrossRef]
- Rifna, E.J.; Pandiselvam, R.; Kothakota, A.; Rao, K.V.S.; Dwivedi, M.; Kumar, M.; Thirumdas, R.; Ramesh, S.V. Advanced process analytical tools for identification of adulterants in edible oils—A review. Food Chem. 2022, 369, 130898. [Google Scholar] [CrossRef]
- Dimitrijevic, A.; Horn, R. Sunflower hybrid breeding: From markers to genomic selection. Front. Plant Sci. 2018, 8, 2238. [Google Scholar] [CrossRef] [PubMed]
- Martinez, A.L.; Quiroz, F.J.; Carrera, A.D. Detection of Plasmopara halstedii in sunflower seeds: A case study using molecular testing. J. Saudi Soc. Agric. Sci. 2021, 20, 395–400. [Google Scholar]
- Dean, C. Coconut oil for Alzheimer’s. J. Am. Acad. Physician Assist. 2012, 25, 1–5. [Google Scholar]
- Sandupama, P.; Munasinghe, D.; Jayasinghe, M. Coconut oil as a therapeutic treatment for alzheimer’s disease: A review. J. Future Foods. 2022, 2, 41–52. [Google Scholar] [CrossRef]
- Kumar, K.A.; Viswanathan, K. Study of UV transmission through a few edible oils and chicken oil. J. Spectrosc. 2013, 2013, 540417. [Google Scholar]
- Liu, R.; Lu, M.; Zhang, Z.; Chang, M.; Wang, X. Evaluation of the antioxidant properties of micronutrients in different vegetable oils. Eur. J. Lipid Sci. Technol. 2020, 122, 1900079. [Google Scholar] [CrossRef]
- Cai, Z.; Li, K.; Lee, W.J.; Reaney, M.T.J.; Zhang, N.; Wang, Y. Recent progress in the thermal treatment of oilseeds and oil oxidative stability: A review. Fundam. Res. 2021, 6, 767–784. [Google Scholar] [CrossRef]
- Savoire, R. Screw pressing applications to oilseeds. Ref. Modul. Food Sci. 2017. [Google Scholar] [CrossRef]
- Savoire, R.; Lanoiselle, J.L.; Vorobiev, E. Mechanical continuous oil expression from oilseeds. A review. Food Bioprocess Technol. 2013, 6, 1–16. [Google Scholar] [CrossRef]
- Singh, K.K.; Wiesenborn, D.; Kangas, N.; Tostenson, K. Screw pressing characteristics of dehulled crambe seed. Trans. ASABE 2004, 47, 199–204. [Google Scholar] [CrossRef]
- Bogaert, L.; Mathieu, H.; Mhemdi, H.; Vorobiev, E. Characterization of oilseeds mechanical expression in an instrumented pilot screw press. Ind. Crops. Prod. 2018, 121, 106–113. [Google Scholar] [CrossRef]
- Mpagalile, J.J.; Clarke, B. Effect of processing parameters on coconut oil expression efficiencies. Int. J. Food Sci. Nutr. 2005, 56, 125–132. [Google Scholar] [CrossRef]
- Karaj, S.; Muller, J. Optimizing mechanical oil extraction of Jatropha curcas L. seeds with respect to press capacity, oil recovery and energy efficiency. Ind. Crops. Prod. 2011, 34, 1010–1016. [Google Scholar] [CrossRef]
- Romuli, S.; Karaj, S.; Latif, S.; Muller, J. Performance of mechanical co-extraction of Jatropha curcas L. kernels with rapeseed, maize or soybean with regard to oil recovery, press capacity and product quality. Ind. Crops. Prod. 2017, 104, 81–90. [Google Scholar] [CrossRef]
- Divisova, M.; Herak, D.; Kabutey, A.; Sigalingging, R.; Svatonova, T. Deformation curve characteristics of rapeseeds and sunflower seeds under compression loading. Sci. Agric. Bohem. 2014, 45, 180–186. [Google Scholar]
- Munson-Mcgee, S.H. D-optimal experimental designs for uniaxial expression. J. Food Process Eng. 2014, 37, 248–256. [Google Scholar] [CrossRef]
- Demirel, C.; Kabutey, A.; Herák, D.; Sedlaček, A.; Mizera, Č.; Dajbych, O. Using Box–Behnken Design Coupled with Response Surface Methodology for Optimizing Rapeseed Oil Expression Parameters under Heating and Freezing Conditions. Processes 2022, 10, 490. [Google Scholar] [CrossRef]
- Gupta, R.K.; Das, S.K. Fracture resistance of sunflower seed and kernel to compressive loading. J. Food Eng. 2000, 46, 1–8. [Google Scholar] [CrossRef]
- Kabutey, A.; Mizera, Č.; Dajbych, O.; Hrabě, P.; Herák, D.; Demirel, C. Modelling and Optimization of Processing Factors of Pumpkin Seeds Oil Extraction under Uniaxial Loading. Processes 2021, 9, 540. [Google Scholar] [CrossRef]
- Kabutey, A.; Herak, D.; Mizera, C.; Hrabe, P. Compressive loading experiment of non-roasted bulk oil palm kernels at varying pressing factors. Int. Agrophysics 2018, 32, 357–363. [Google Scholar] [CrossRef]
- Erum, Z.; Rehana, S.; Mehwish, A.H.; Anjum, Y. Study of Physicochemical Properties of Edible Oil and Evaluation of Frying Oil Quality by Fourier Transform-Infrared (FT-IR) Spectroscopy. Arab. J. Chem. 2014, 10, 3870–3876. [Google Scholar]
- Herchi, W.; Ammar, K.B.; Bouali, I.; Abdallah, I.B.; Guetet, A.; Boukhchina, S. Heating effects on physicochemical characteristics and antioxidant activity of flaxseed hull oil (Linum usitatissimum L.). Food Sci. Technol. 2016, 36, 97–102. [Google Scholar] [CrossRef]
- Tang, T.S. 8 Analysis of oleochemicals. Oleochem. Manu. Appl. 2001, 4, 227. [Google Scholar]
- de Souza, T.R.P.; Olenka, L.; Peternella, W.S. A study of degradation in vegetable oils by exposure to sunlight using Fourier Transform Infrared Spectroscopy. Mater. Sci. Appl. 2020, 11, 678–691. [Google Scholar] [CrossRef]
- Amadi, B.A.; Lele, K.C.; Duru, M.K.C. Extraction and characterization of vegetable oils from legume and palmae; using African Oil Bean (Pentaclethra macrophylla) and ‘Akwu Ojukwu’ (Elais guineensis) respectively. Am. J. Biol. Life Sci. 2013, 1, 7–10. [Google Scholar]
- Katkade, M.B.; Syed, H.M.; Andhale, R.R.; Farooqui, A.S. Comparative study of physicochemical properties of different edible vegetable oils. J. Sci. Agric. Eng. 2018, 8, 235–238. [Google Scholar]
- Adeyanju, J.A.; Ogunlakin, G.O.; Adekunle, A.A.; Alawode, G.E.; Majekolagbe, O.S. Optimization of oil extraction from coconut using response surface methodology. J. Chem. Pharm. Res. 2016, 8, 374–381. [Google Scholar]
- Ifa, L.; Syarif, T.; Sartia, S.; Juliani, J.; Nurdjannah, N.; Kusuma, H.S. Techno-economics of coconut coir bioadsorbent utilization on free fatty acid level reduction in crude palm oil. Heliyon 2022, 8, e09146. [Google Scholar] [CrossRef]
- Di Pietro, M.E.; Mannu, A.; Mele, A. NMR determination of free fatty acids in vegetable oils. Processes 2020, 8, 410. [Google Scholar] [CrossRef]
- Cammerer, B.; Kroh, L.W. Shelf life of linseeds and peanuts in relation to roasting. Food Sci. Technol. 2009, 42, 545–549. [Google Scholar] [CrossRef]
- Adejumo, B.A.; Inaede, S.G.; Adamu, T.S. Effect of moisture content on the yield and characteristics of oil from valiculatum and V. calycinium. Pac. Sci. 2013, 48, 458–463. [Google Scholar]
- Okene, E.O.; Evbuomwan, B.O. Solvent extraction and characteristics of oil from coconut seeds using alternative solvents. Int. J. Eng. Technol. Res. 2014, 2, 135–138. [Google Scholar]
- Atinafu, D.G.; Bedemo, B. Estimation of total free fatty acid and cholesterol content in some commercial edible oils in Ethiopia, Bahir DAR. J. Cereals Oilseeds 2011, 2, 71–76. [Google Scholar] [CrossRef]
- Lobo, V.; Patil, A.; Phatak, A.; Chandra, N. Free radicals, antioxidants and functional foods: Impact on human health. Pharmacogn. Rev. 2010, 4, 118–126. [Google Scholar] [CrossRef] [PubMed]
- Konuskan, D.B.; Arslan, M.; Oksuz, A. Physicochemical properties of cold pressed sunflower, peanut, rapeseed, mustard and olive oils grown in the Eastern Mediterranean region. Saudi J. Biol. Sci. 2019, 26, 340–344. [Google Scholar] [CrossRef] [PubMed]
- Codex Alimentarius Commission. Fats, Oils and Related Products, 2nd ed.; Food and Agriculture Organizaation of the United Nations: Rome, Italy, 2001; Volume 8. [Google Scholar]
- ISI. Indian Standard Methods for Analysis of Oilseeds. In Indian Standard Institute; IS: 3579; ISI: New Delhi, India, 1966. [Google Scholar]
- Blahovec, J. Agromatereials Study Guide; Czech University of Life Sciences Prague: Prague, Czech Republic, 2008. [Google Scholar]
- Keneni, Y.G.; Hvoslef-Eide, A.K.T.; Marchetti, J.M. Mathematical modelling of the drying kinetics of Jatropha curcas L. seed. Ind. Crops. Prod. 2019, 132, 12–20. [Google Scholar] [CrossRef]
- Niu, L.; Li, J.; Chen, M.S.; Xu, Z.F. Determination of oil contents in Sacha inchi (Plukenetia volubilis) seeds at different developmental stages by two methods: Soxhlet extraction and time-domain nuclear magnetic resonance. Ind. Crops. Prod. 2014, 56, 187–190. [Google Scholar] [CrossRef]
- Mohammadpour, H.; Sadrameli, S.M.; Eslami, F.; Asoodeh, A. Optimization of ultrasound-assisted extraction of Moringa peregrina oil with response surface methodology and comparison with Soxhlet method. Ind. Crops. Prod. 2019, 131, 106–116. [Google Scholar] [CrossRef]
- Gürdil, A.K.G.; Kabutey, A.; Selvi, K.C.; Hrabe, P.; Herak, D.; Frankova, A. Investigation of heating and freezing pretreatments of mechanical, chemical and spectral properties of bulk sunflower seeds and oil. Processes 2020, 8, 411. [Google Scholar] [CrossRef]
- Deli, S.; Farah Masturah, M.; Tajul Aris, Y.; Wan Nadiah, W.A. The effects of physical parameters of the screw press oil expeller on oil yield from Nigella sativa L. seeds. Int. Food Res. J. 2011, 18, 1367–1373. [Google Scholar]
- Chanioti, S.; Constantina, T. Optimization of ultrasound-assisted extraction of oil from olive pomace using response surface technology: Oil recovery, unsaponifiable matter, total phenol content and antioxidant activity. LWT Food Sci. Technol. 2017, 79, 178–189. [Google Scholar] [CrossRef]
- Lysiak, G. Fracture toughness of pea: Weibull analysis. J. Food Eng. 2007, 83, 436–443. [Google Scholar] [CrossRef]
- Demirel, C.; Kabutey, A.; Herák, D.; Hrabě, P.; Mizera, Č.; Dajbych, O. Optimizing Uniaxial Oil Extraction of Bulk Rapeseeds: Spectrophotometric and Chemical Analyses of the Extracted Oil under Pretreatment Temperatures and Heating Intervals. Processes 2021, 9, 1755. [Google Scholar] [CrossRef]
- Orozco, F.D.A.; Sousa, A.C.; Araujo, M.C.U.; Domini, C.E. A new flow UV-Vis kinetics spectrophotometric method based on photodegradative reaction for determining the oxidative stability of biodiesel. Fuel 2020, 26, 116–197. [Google Scholar]
- Statsoft Inc. STATISTICA for Windows; Statsoft Inc.: Tulsa, OK, USA, 2013. [Google Scholar]
- Khan, L.M.; Hanna, M.A. Expression of oil from oilseeds—A Review. J. Agric. Eng. Res. 1983, 28, 495–503. [Google Scholar] [CrossRef]
- Li, W.G.; Sun, X.L.; Zu, Y.G.; Zhao, X.H. Optimization peony seed oil extraction process at suitable temperature and physicochemical property analysis. Bull. Botan. Res. 2020, 40, 73–78. [Google Scholar]
- Deng, R.; Gao, J.; Yi, J.; Liu, P. Could peony seeds oil become a high-quality edible vegetable oils? The nutritional and phytochemistry profiles, extraction, health benefits, safety and value-added-products. Food Res. Int. 2022, 156, 111200. [Google Scholar] [CrossRef] [PubMed]
- Dodoo, D.; Adjei, F.; Tulashie, S.K.; Adukpoh, K.E.; Agbolegbe, R.E.; Gawou, G.; Manu, G.P. Quality evaluation of different repeatedly heated vegetable oils for deep-frying of yam fries. Meas. Food. 2022, 7, 100035. [Google Scholar] [CrossRef]
- Hoffmann, G. The Chemistry and Technology of Edible Oils and Fats and Their High-Fat Products; Academic Press: New York, NY, USA, 1989; pp. 63–68. [Google Scholar]
- Reuber, M. New Technologies for processing Crambe abyssinica. M.S. Thesis, Iowa State University, Ames, IA, USA, 1992. [Google Scholar]
- Singh, K.K.; Wiesenborn, D.P.; Tostenson, K.; Kangas, N. Influence of moisture content and cooking on screw pressing of crambe seed. JAOCS 2002, 79, 165–170. [Google Scholar] [CrossRef]
- Choo, W.S.; Birch, E.J.; Dufour, J.P. Physicochemical and stability characteristics of flaxseed oils during pan-heating. JAOCS 2007, 84, 735–740. [Google Scholar] [CrossRef]
- Ajai, A.I.; Adedokun, T.A.; Inobeme, A.; Jacob, J.O. Determination of physicochemical properties of selected vegetable oils in Minna. FUW Trends Sci. Technol. J. 2016, 1, 475–478. [Google Scholar]
- Vicentini-Polette, C.M.; Ramos, P.R.; Goncalves, C.B.; De Oliveira, A.L. Determination of free fatty acids in crude vegetable oil samples obtained by high-pressure processes. Food Chem. X 2021, 12, 100166. [Google Scholar] [CrossRef]
- Eke-Ejiofor, J.; Beleya, E.A.; Allen, J.E. Effect of variety on the quality parameters of crude soybean oil. Am. J. Food Sci. Technol. 2021, 9, 69–75. [Google Scholar]
- Nduka, J.K.C.; Omozuwa, P.O.; Imanah, O.E. Effect of heating on the physiological properties of selected vegetable oils. Arab. J. Chem. 2021, 14, 103063. [Google Scholar] [CrossRef]
- Tiffour, I.; Dehbi, A.; Mourad, A.-H.I.; Belfedal, A. Synthesis and characterization of a new organic semiconductor material. Mater. Chem. Phys. 2016, 178, 49–56. [Google Scholar] [CrossRef]
- Gonzalez, M.F.; Barbero, G.F.; Alvarez, J.A.; Ruiz, A.; Palma, M.; Ayuso, J. Authentication of virgin olive oil by a novel curve resolution approach combined with visible spectroscopy. Food Chem. 2007, 220, 331–336. [Google Scholar] [CrossRef] [PubMed]
- Wang, H.; Xin, Y.; Wan, X. Spectral detection technology of vegetable oil: Spectral analysis of porphyrins and terpenoids. Spectrochim. Acta Part A Mol. Biomol. Spectrosc. 2021, 261, 119965. [Google Scholar] [CrossRef]
- Altman, D.G.; Bland, J.M. Standard deviations and standard errors. BJM 2005, 331, 903. [Google Scholar] [CrossRef][Green Version]